I treasure disagreements because I find friction essential to team work. Discussing agreements, on the other hand, is a waste of time.
Let's take a team of five, who's prioritizing tasks on a scale from 1 (least important) to 5 (most important).
The first task scores 4, 4, 4, 4, 4. The team agrees, there's nothing to discuss here.
But something happens with the second task: 1, 5, 1, 5, 1. The average (2.6) makes it the least important task so far:
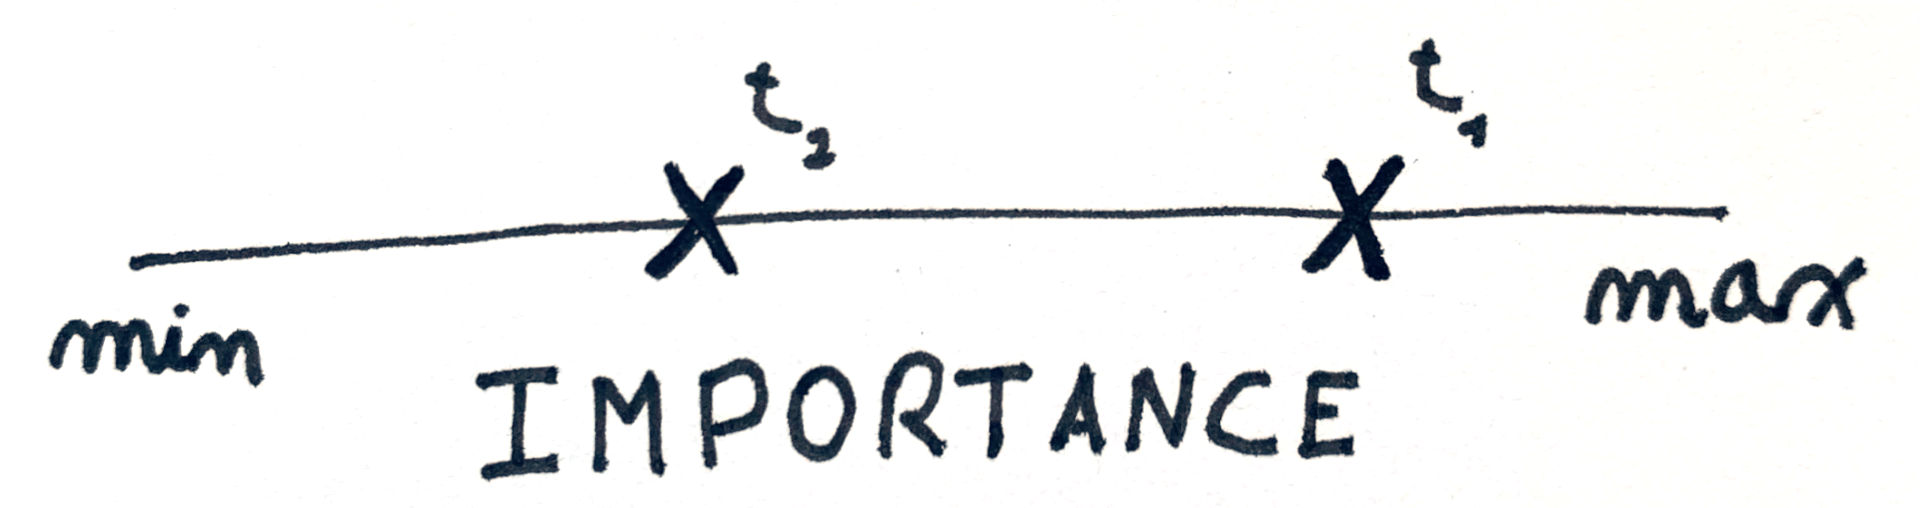
But it would be a mistake using it as the final score.
Why did three people vote 1 and two vote 5?
Digging deeper comes with two possible outcomes. Either the team realigns by updating their votes or the disagreement remains revealing assumptions that should be clarified.
They decide to defer the discussion and continue with the following tasks. Unsurprisingly, the team realizes that unanimous votes are a rare exception. So should they discuss all of them?
Of course not, it's enough to focus on the biggest misalignments. The DISAGREEMENT formula is nowhere to be found in the spreadsheet, but STDEV is a valid alternative:
In statistics, the standard deviation is a measure of the amount of variation or dispersion of a set of values. A low standard deviation indicates that the values tend to be close to the mean (also called the expected value) of the set, while a high standard deviation indicates that the values are spread out over a wider range.
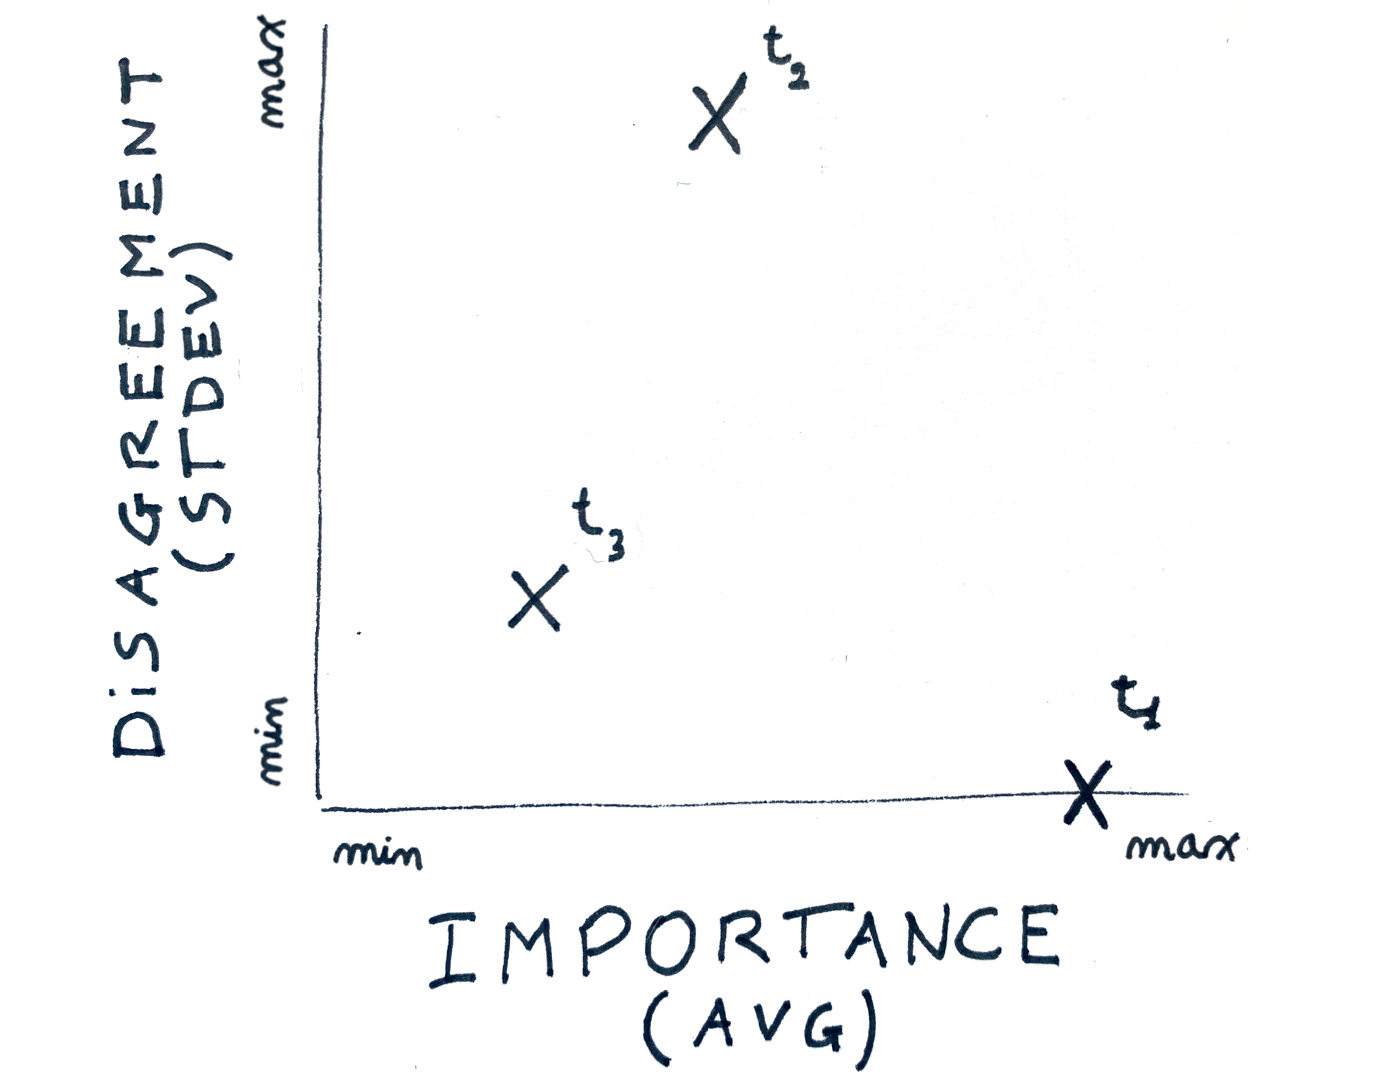
In plain English, standard deviation measures how far apart are individual values relative to their average. For example, let's take the first three tasks on the list:
- 4, 4, 4, 4, 4 has an average of 4.0 and a standard deviation of 0.0;
- 1, 5, 1, 5, 1 has an average of 2.6 and a standard deviation of 2.2;
- 2, 1, 1, 2, 1 has an average of 1.4 and a standard deviation of 0.5.
That works! The higher the standard deviation, the bigger the disagreement:
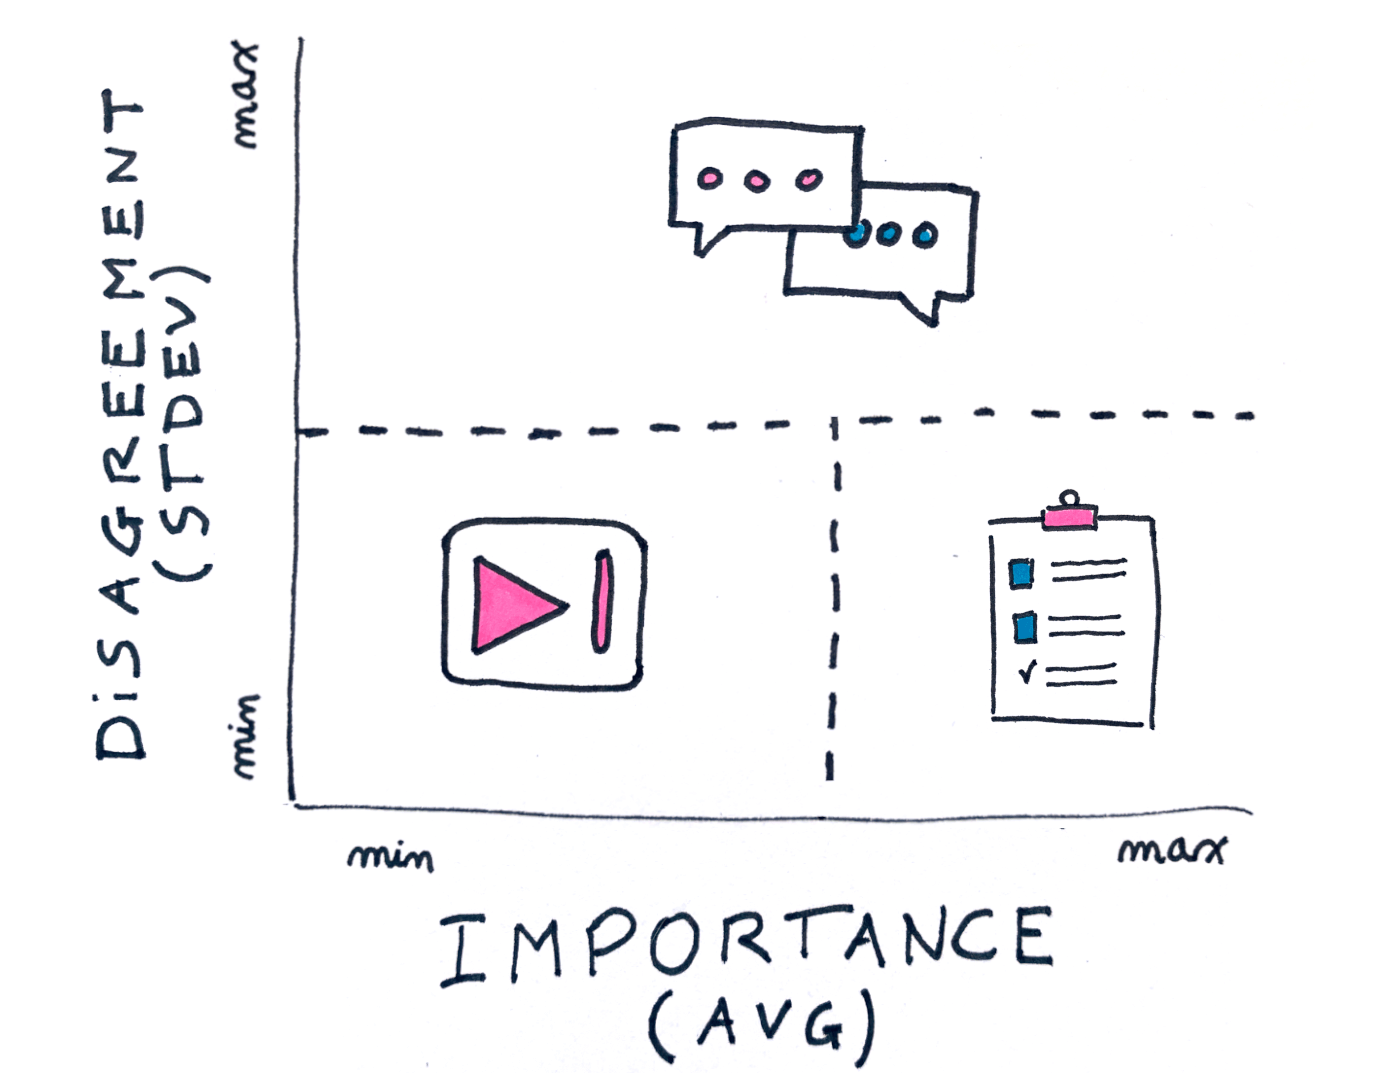
Taking into account importance (average) and disagreement (stdev) there are four quadrants:
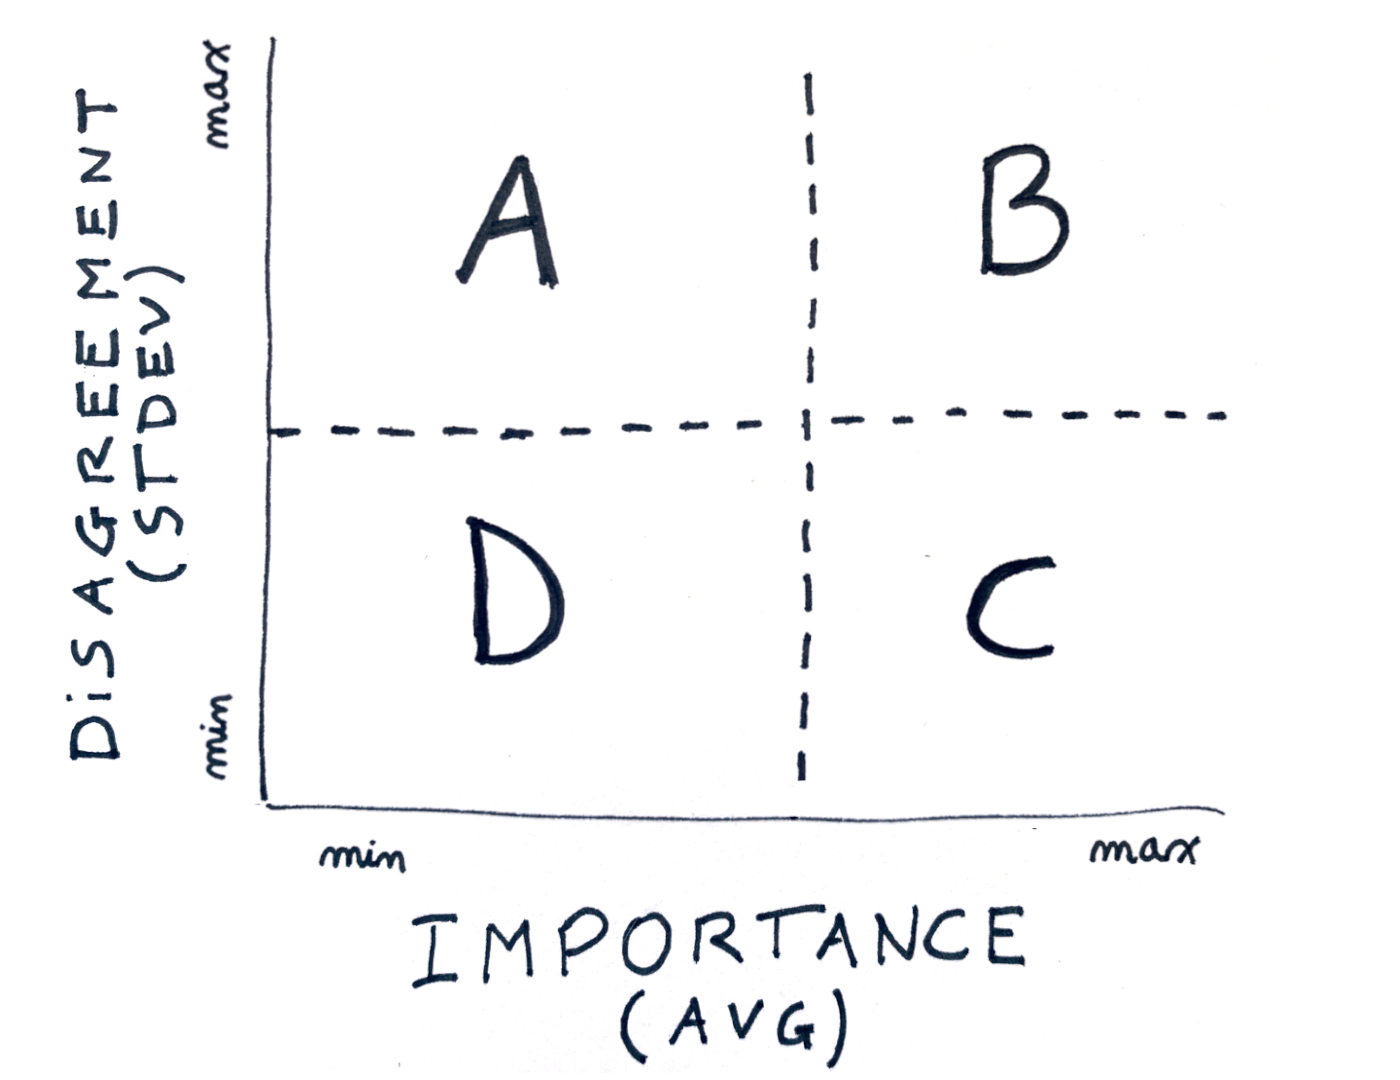
As a rule of thumb:
- A and B is where disagreement is high: discuss those tasks.
- C is where the team agrees on high importance: do as soon as possible.
- D is where the team agrees on low importance: skip.

Treasure disagreements.
Shout out to Mike, Jerred, Pina and Gosia. This article would not exist without our recent experiments. I love disagreeing with you.